Introduction
For the first field exercise of the semester the class was asked to create model landscapes, in the planter boxes in the Phillips court yard, out of snow and soil. After the model terrain was created the next objective was to survey the terrain in whatever way the groups felt was most appropriate. Joe Hupy the instructor suggested that the groups create a grid system for point placement and elevation recordings. In order to do this we were provided with supplies such as tape, meter sticks, string and various other items. After using a grid system to create x,y position points and z values as elevation these points are then transferred into a Excel Spread Sheet for later use in terrain modeling software.Working as a group, feeding off of each others ideas and the professors suggestions were all key parts to completing this exercise.
Methods
The first step in our method was to decide how we wanted to accomplish the task before us. We decided that the wooden boarder around the planter box would be our 0 elevation point on which the string grid would rest. Once we decided our 0 point we dug out and shaped the snow into our model terrain as seen in figure 1.
 |
| Creating terrain. Figure 1 |
The box was formed into a series of valleys, ridges, plains and basins using our hands and a shovel. To make the surveying easier on ourselves we made sure that all of our terrain features were below the edge of the box or lower than our 0 point as you can see in figures 2 and 3.
 |
| Figure 2 |
 |
| Figure 3 |
Once the terrain was complete we began to set up our grid for surveying. We used thumb tacks spaced 5 cm apart to attach the string which we ran length wise on the box. We then placed meter sticks across the width of the box to create our 10x10 cm grid pattern as seen in figure 4.
 |
| 5x5 cm grid system. Figure 4 |
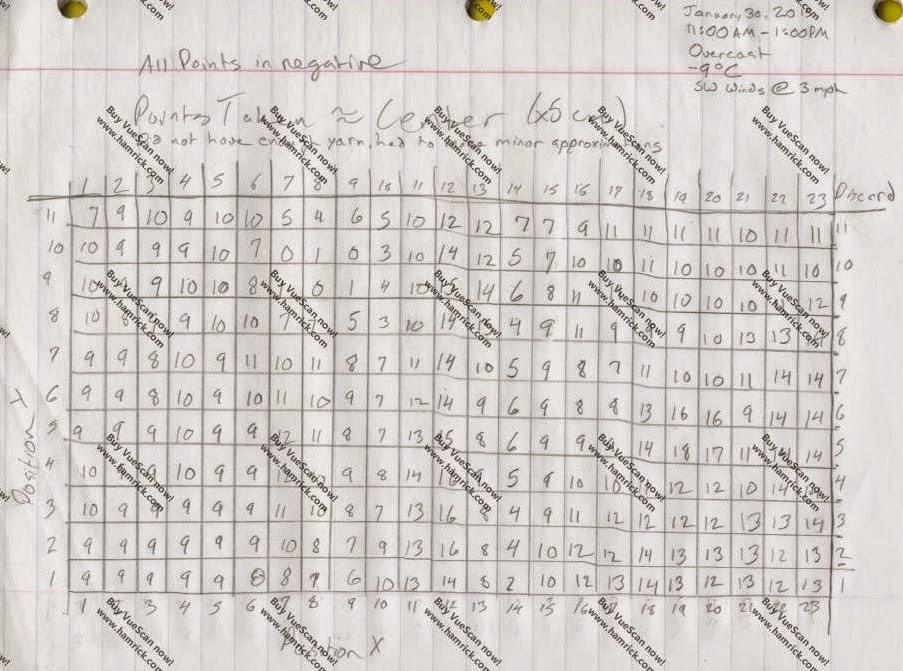
Once we had the grid set up we took depth measurements from the center of the grid squares down from our 0 point or the string height. We recorded all of these values and ended up with the chart below in figure 5.
 |
| Field notes. Figure 5 |
Then to make the next step of this project easier where we have to make an electronic terrain model these points were put into an Excel Spread sheet laid out the same way as our original point chart. (Figure 6) All of our z values are negative because we were measuring down from the rim of the box and none of our model terrain came above the rim of the box. In total we ended up with 253 measurement points. Ranging from depths of 0 to 19 cm.
 |
| Excel grid points. Figure 6 |
Discussion
The surveying method we chose was fairly efficient and we completed the exercise in a pretty timely manner. From the beginning of or terrain shaping to measuring the last point took about an hour and a half, which I think we were all thankful for because it was rather cold outside. The accuracy of our data points is fairly high, I would say, with the possibility of some human error in the measurement method or the data transfer from paper to excel sheet. Overall though I think our methodology was very solid and I expect the electronic terrain model to show that.
Conclusion
The skills learned and used in this exercise are very applicable to real life situations when working out in the field. Being given a task with little direction on how to complete the task forced us to think out side the box, get creative, and work effectively in a group setting to complete this exercise.


No comments:
Post a Comment